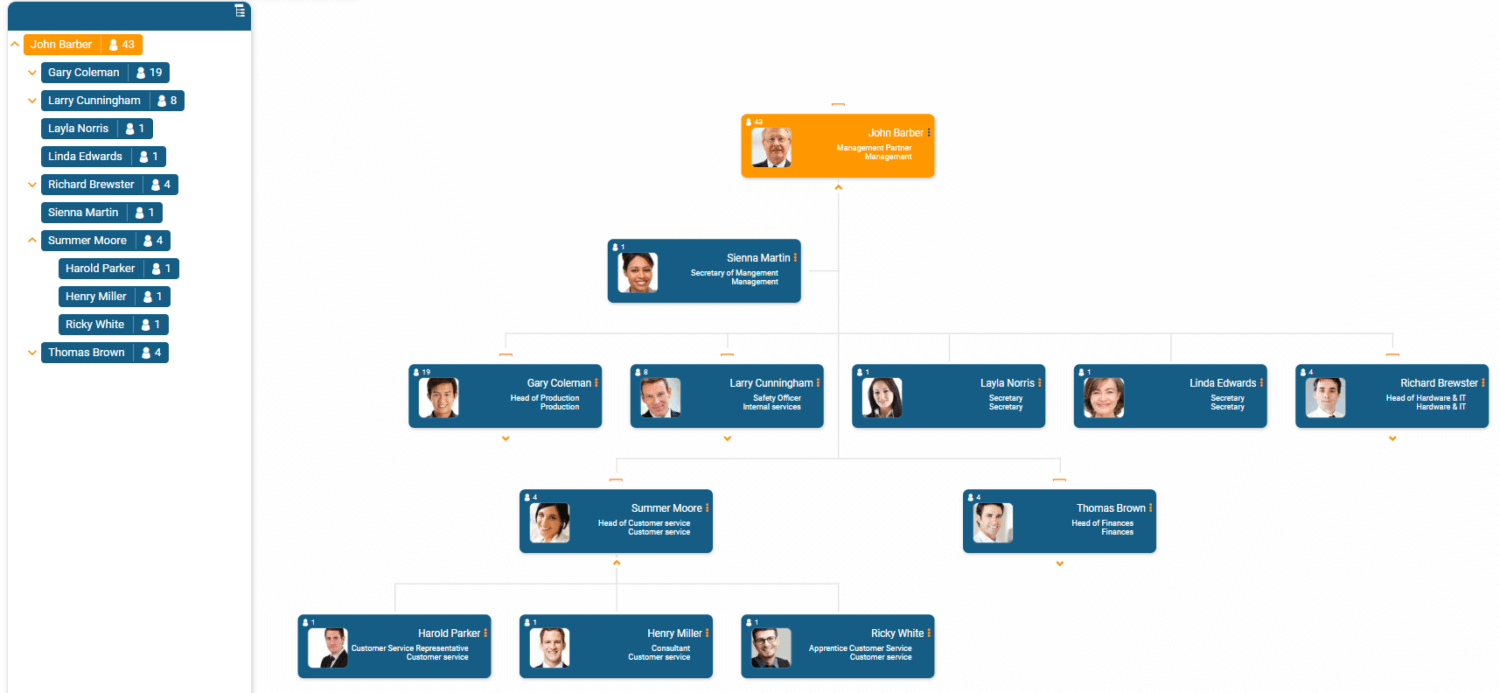
When people think of an organisation chart, they often imagine a family-tree of their company’s structure that’s mainly used to look up somebody’s phone number or last name. But there’s so much more to an org chart. With the following use cases, we’d like to give you an overview of an org chart’s full potential.
1) The Central Directory
The most common use case for an organisation chart is probably how employees can easily refer to it as a directory of their entire company that lets employees know who’s who in the zoo. Directory-style org charts can be quite basic, usually only showing name and title. However, they become a lot more useful once you include more information.
At the very least, organisation charts should include employee photos. This makes it easier for colleagues to seek one another out, especially in larger organisations. Further details like phone number, location, or even whether or not the employee is on parental leave can be added to the chart for better visibility into the workforce.

2) A Better Way to Plan
A robust org chart tool can help in planning team, department, and company reorganisations. Using an org chart to visualise a restructure can help avoid overlooking issues such as having too many vacancies on a team. Tracking budgets for teams and departments within an organisation chart can ensure that any changes your company is planning are feasible.
The more collaborative the planning, the better. With a tool that allows for real-time tracking as well as multiple users, teams are able to plan more efficiently, without having to send plans back and forth to one another. Instead, members of various teams can work together within the chart so that no plans or versions are lost.
3) Tracking Roles, Responsibilities & Workloads
Sometimes it can be difficult to see just how overworked an employee is until it’s visualised. With an organisation chart that tracks roles and responsibilities, team members and managers can quickly see if one person is taking on a majority of work or if it’s spread out over the right amount of people.
Tracking KPIs like this within your org chart, makes it easier to plan for additional headcount if workloads become too much for an individual or an entire team. Being able to compare similar roles and workloads enables managers to see how comparable teams are structured and which structures result in the best outputs.
4) Bring Remote Workers Together
Since many companies now offer their employees to telecommute either full- or part-time, it is important to have tools available to facilitate the collaboration between these remote workers and teams. An organisation chart can help remote employees get a better picture of what their team looks like and who they can go to within the organization.
As face-to-face time may be limited with remote workers and teams, it is crucial to have a structure in place that allows them to easily access the information of their colleagues. Since walking to someone’s desk to ask a question isn’t a possibility, organisation charts help by giving more visibility into a team mate’s information.
If you’d like learn more about the different ways you can use org charts then don’t hesitate to contact us. Feel free to take a look at some of our org design tools:

