
When you think of org charts, you immediately picture lines and boxes with employee information arranged in a hierarchical order. While that’s one way of doing it, there’s a few other things you should keep in mind before you get started.
To save some time, I’m going to assume that you understand the benefits of using an automated org charting tool. And, I’ll skip straight to the question: What’s the best way to make organisational charts for small business and medium enterprise?
Here’s 4 simple steps to figure it out:
| Step 1: Select the most suitable structure type |
| Step 2: Collect relevant employee information |
| Step 3: Choose the right tool for your business |
| Step 4: Regularly review, update and monitor |
Creating organisational charts for small business & medium enterprise
Step 1
Select the most suitable structure type
There are many different structure options that you can choose from, and your decision should be based on your business’s goals and requirements.
Here’s some common structures to define the reporting lines:
- Hierarchical – This is the most common, where employees are ranked into different levels. It’s a top-down representation of your organisation and gives a clear indication of the chain of command.
- Functional / Departmental – This is a good option if your business is big enough to be divided into business functions. Your org chart would display the head of each department such as Marketing, Sales, Finance etc. at the top and then include all the individuals who report to them. While hierarchical and functional structures look very similar, the latter emphasises on departments and business functions more.
- Matrix – This structure is useful if your employees have to report to multiple supervisors. A matrix org chart will illustrate the relationship between an employee, their immediate supervisor and the project manager as well.
- Holacracy – Holacracies use circles to represent their structure. In a holacracy, employees are grouped into agile teams, known as squads, communities or networks. Each team is responsible for the end-to-end management of a project, process or product and all employees stand on the same level in the business.
This is a relatively new type of structure for org charts and is meant to be more agile and fluid in order to accommodate changes in the workplace more easily. Below is an example to help you understand:
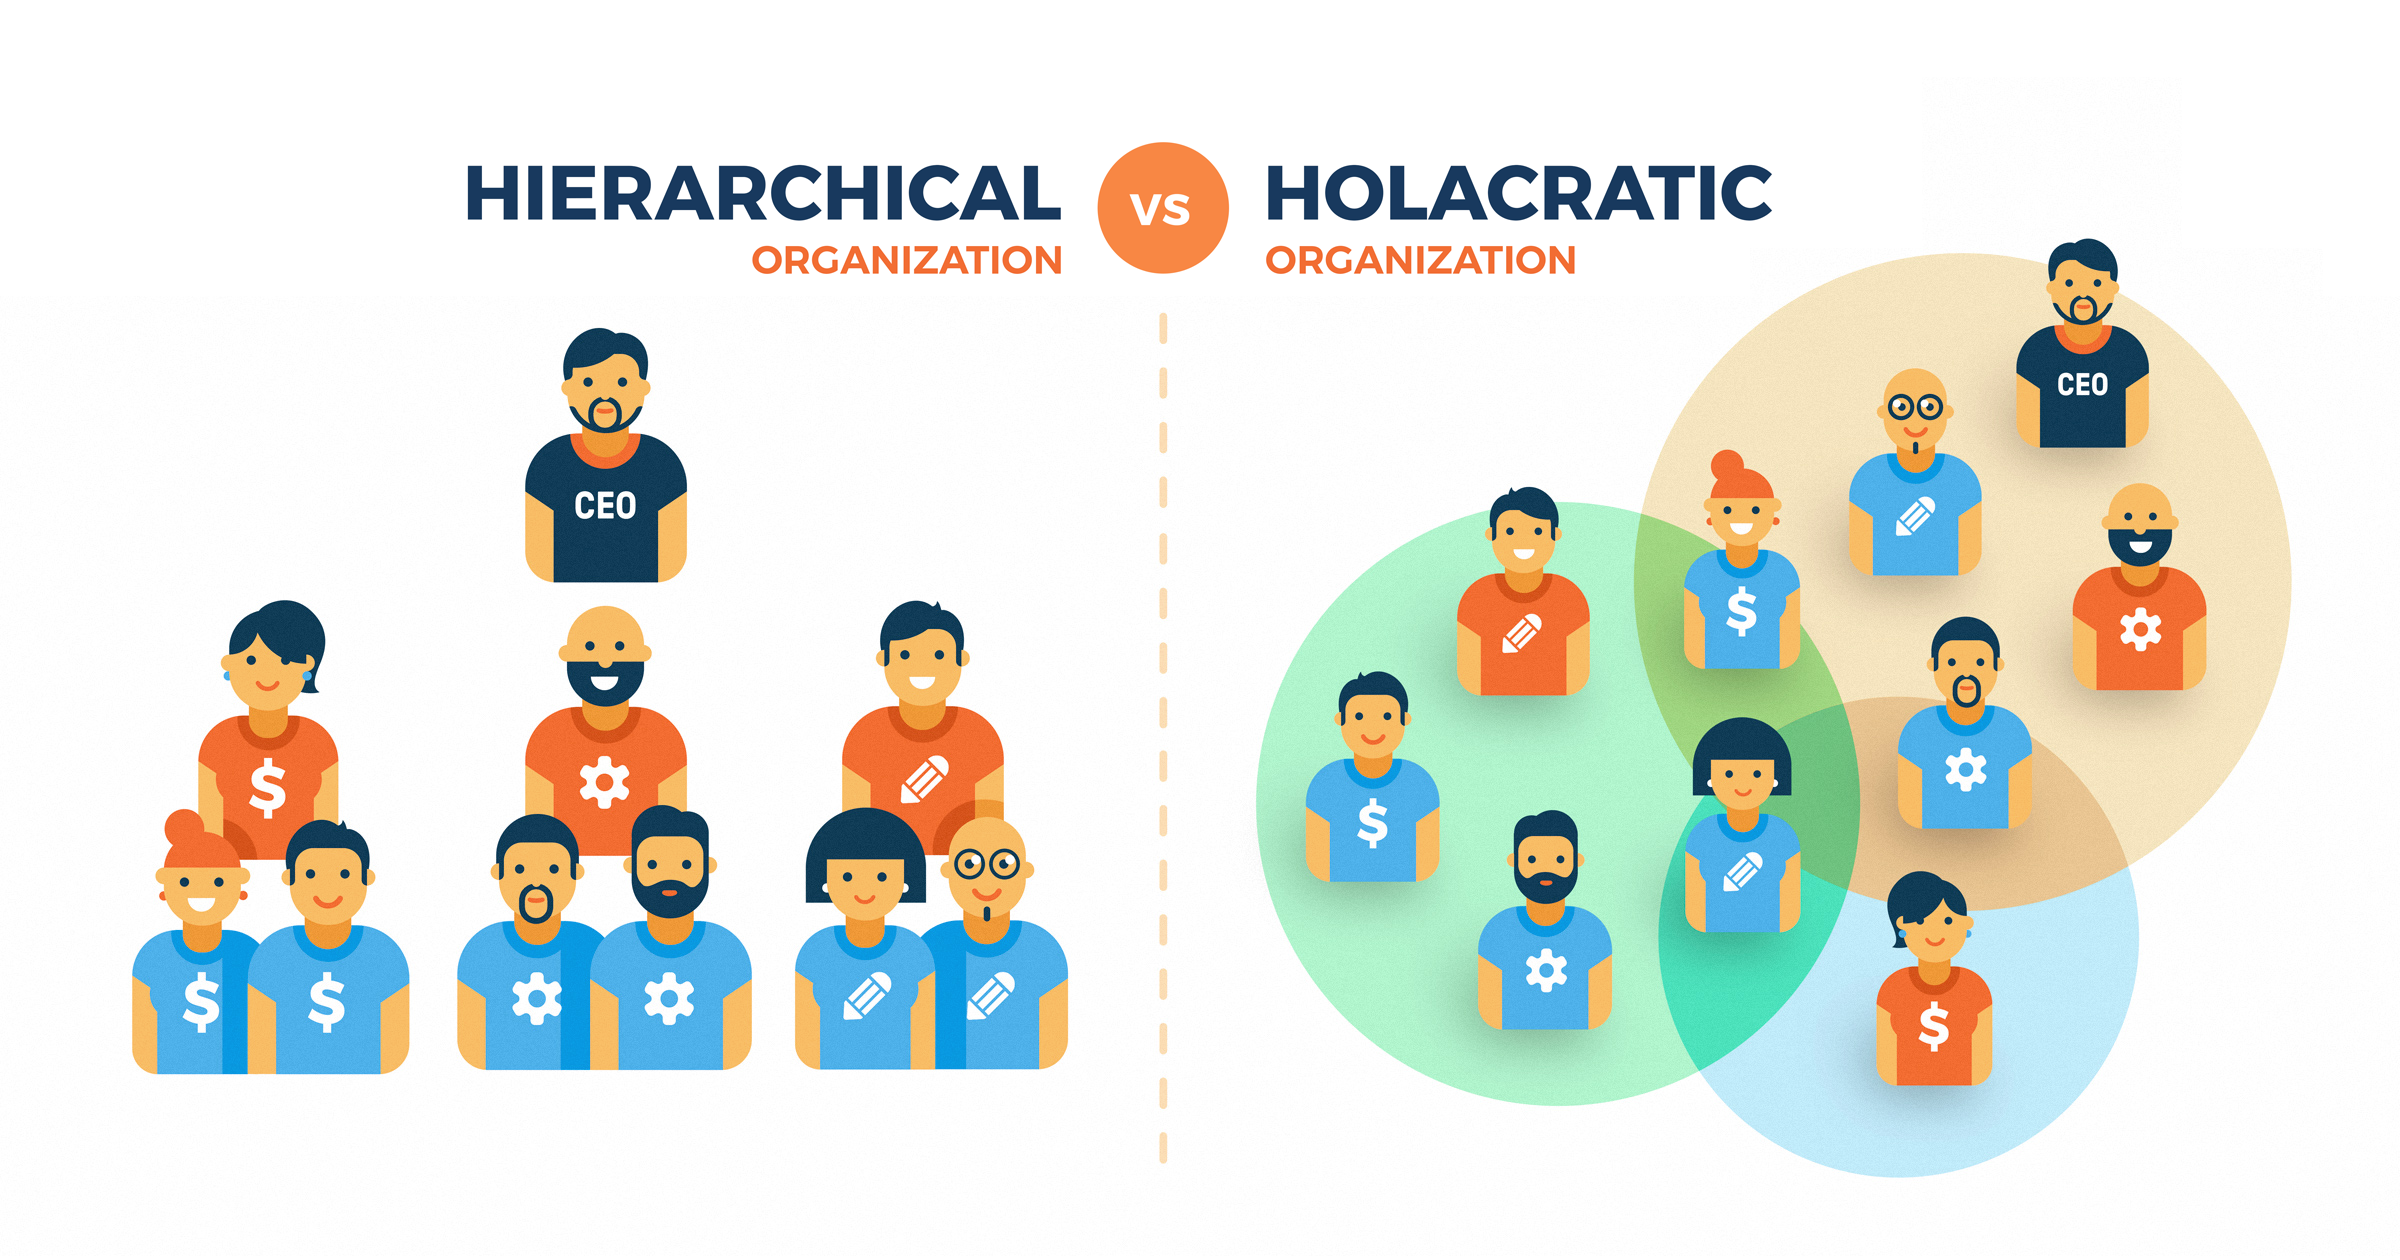
Source: https://railsware.com/blog/holacracy-in-action-how-each-railswarian-can-influence-company-strategy/
In addition to choosing your structure type, you should also consider whether you want your org chart to be person based or position based. A position to position hierarchy is more common in Australia but not all organisations are the same. Click here to find out what would work best for you.
Step 2
Collect relevant employee information
Once you know what type of structure you want, gather a list of all your employees and the information you would like to include in your org chart.
For instance, If you’ve chosen a functional structure, your list would be organised based on departments. If you’ve selected a matrix structure, then you need to clearly define all supervisory relationships and differentiate between immediate and project managers.
One important thing to remember when collecting your employees information is to make sure you have at least one field that is unique to them. This could be either their email address or employee ID. This would make it easier when you import your data and need to differentiate your employees.
Step 3
Choose the right tool for your business
Selecting the right org charting tool is dependent on a number of factors such as:
- Budget
- Number of employees
- How often you will use the org chart
- How many times will you update/refresh your org chart
Many HRIS and payroll systems have built-in capabilities that allow you to build an org chart. Although it has only basic capabilities, it’s a good starting point if you have limited experience and only need a rudimentary org chart.
Though, you should really look for a solution that will scale with your business. There are a few tools that offer a free trial so we can test how it fits with your requirements.
Here are some popular solutions available in Australia:
- orginio
- OrgPlus Desktop (this is approaching end of life)
- Canva
- Lucid Chart
- PowerPoint
- Venngage
- Visme
Most of these tools still involve a decent amount of manual work. This means that you will need to create individual boxes and add all the information for each employee yourself.
orginio, on the other hand, will automatically generate the org chart once you’ve imported your CSV file or connected your payroll system.
If you have the budget, it’s better to invest in a solution that will do the heavy lifting for you – saving you hours of manual work that can be better spent on more value adding projects.
Want to try an affordable org charting tool that securely integrates with your payroll system? Fill out the form below to start your 14-day free trial (no credit card information required).
|
|
Step 4
Regularly review and update your org chart
Depending on the movement in your organisation, i.e. employees joining or leaving, you can choose to update your charts every day, week or month.
In addition to adding new employees or deleting existing ones, you should also ensure that everyone’s information is up to date. Since the last time you refreshed your org chart, has anyone’s address changed? Have they completed a course or received a certification that needs to be included in their records?
Tools like orginio will refresh the data automatically, so you don’t need to worry about updating the fields yourself.
Though, if you’re doing this manually – you should have a formal process for keeping data up to date. Here’s a list of important fields that you should check every few weeks to keep your org charts accurate:
- Name
- Title
- Salary (orginio allows you to restrict access to this field with access control)
- Department
- Employment type
- Location (if you have multiple office branches)
- Degrees and certifications
- Address
- Phone number
So, what’s the bottom line?
While an org chart’s basic purpose is to illustrate how your organisation functions, it can do a whole lot more. A dedicated tool like orginio can help you automate complex HR reporting and can create better visibility over workforce metrics that are important to track (like leave, headcount, span of control and budgets).
Taking the time to set up an automated org chart just makes sense, you’ll save yourself time now and into the future using a tool that will scale with your business.
Start your orginio free trial today or if you’re looking for more inspiration, check out our article covering 3 things you need to know for best practice org charts.