
")
How to track workforce KPIs in charts
A great way to keep an eye on important key metrics is to display them in detail on your org chart.
Use case: Charlotte wants to display a company’s headcount. She can select the key figure ‘Headcount’ in the KPIs settings. The respective number of employees per object will appear in her org chart within seconds.
How to edit workforce KPIs in your org chart:
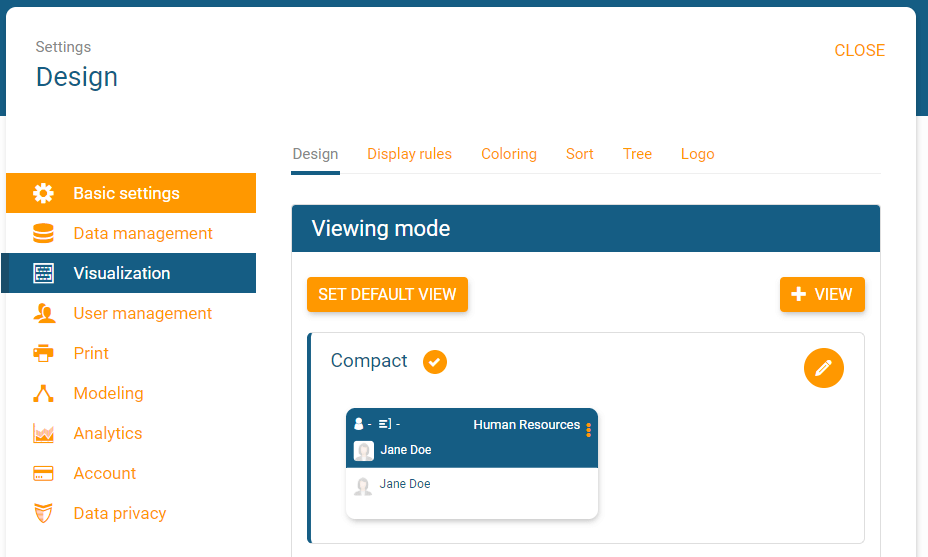
1. Navigate to ‘visualisation’ in the settings and stay on the tab ‘design’
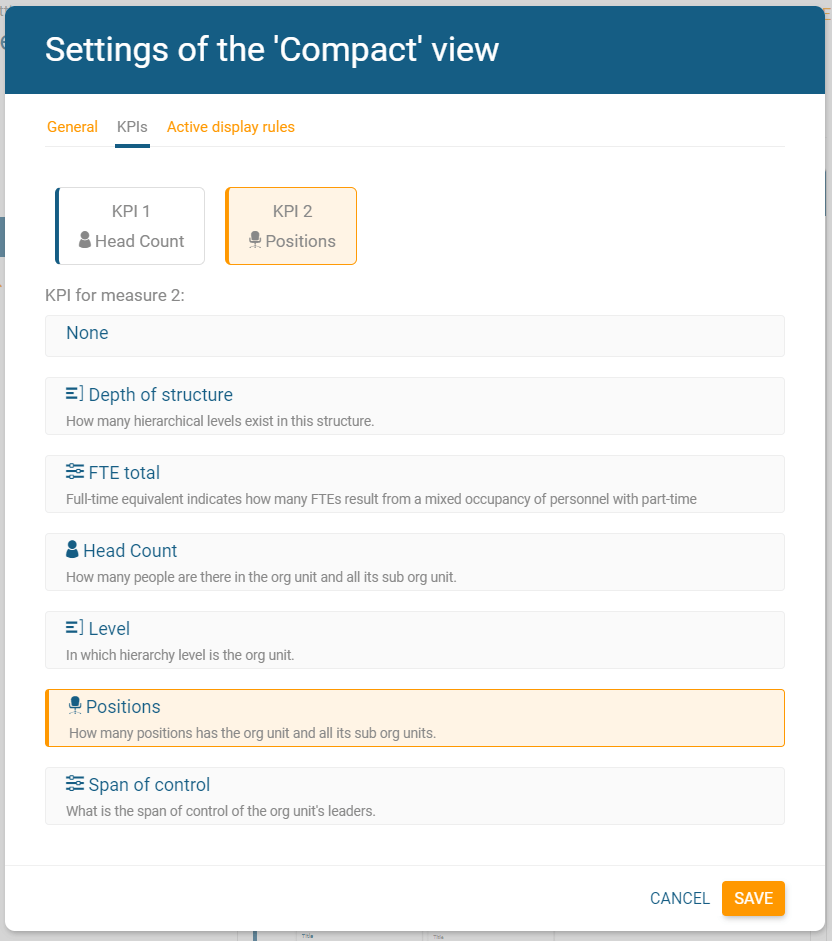
2. Click the edit button of any of your viewing modes and then go to the tab ‘KPI’
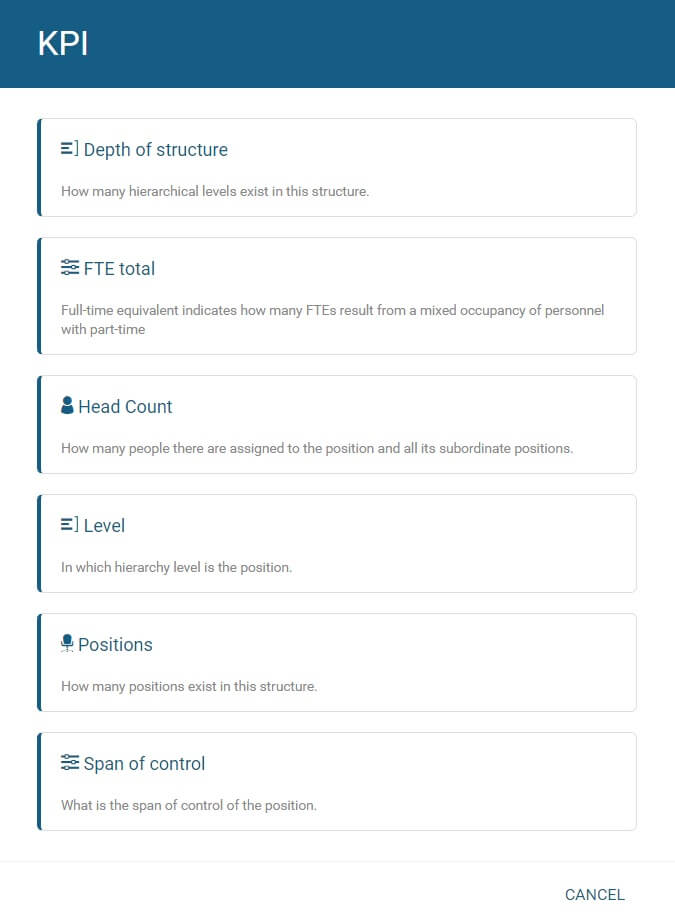
3. Select the KPI you are interested in (headcount, FTE total, level and positions)
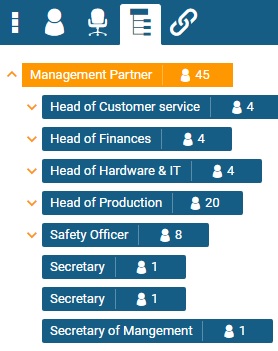
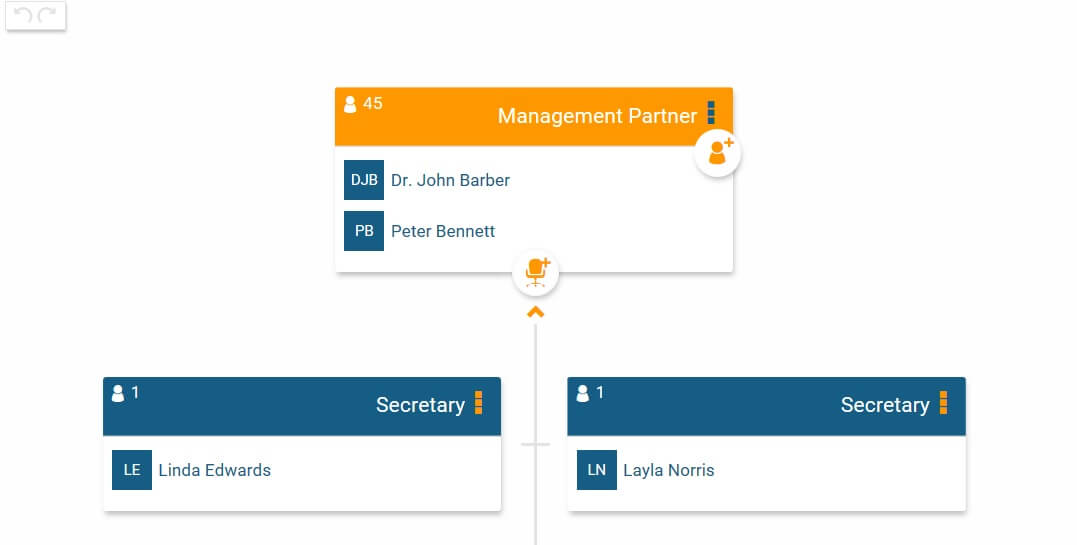
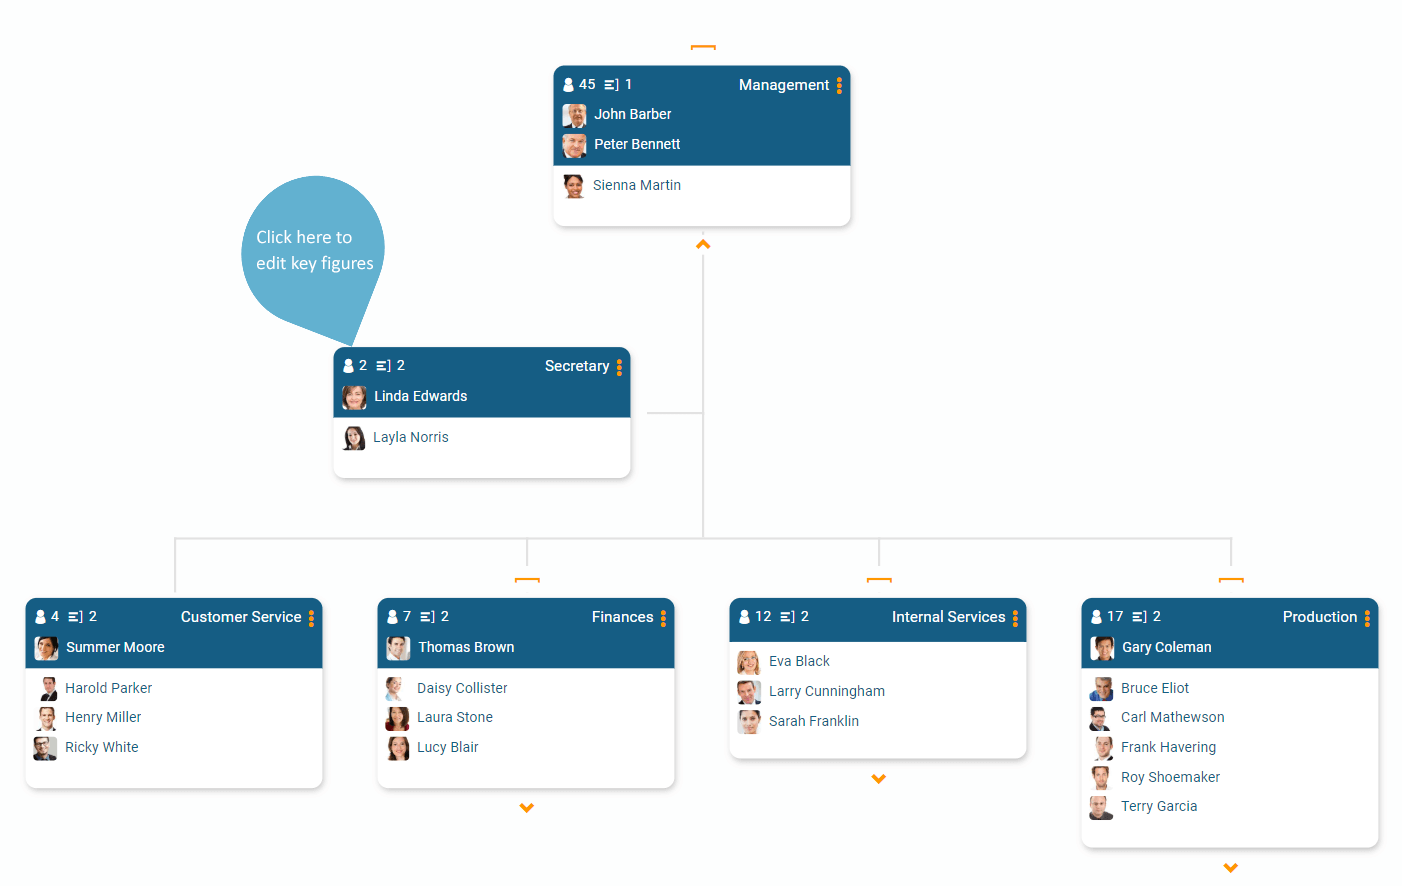
4. The chosen metric will now show in the hierarchy tree and your org chart
See a full step-by-step walk through of how to edit your KPIs in orginio below:
Determine default key figures
Orginio allows you to choose which key figures you would like to have displayed by default within your org chart. From a list of workforce KPIs, you can choose up to two, which you always want to have an eye on at the top level.
You can choose the default key figures for your org chart in KPI settings, as shown in the images below. You are free to change this at anytime.
Want to do a quick change to the default KPIs in the front end? This can easily be done directly in the org chart by clicking on the key figures and choosing different ones in the appearing dialog.

If you’re having any issues with your workforce KPIs or anything else, please don’t hesitate to reach out to our team. We’d be happy to walk you through it.