")
Why is it important to model a reorganisation?
The world today is one of change. That is also true for organisational structures.
There are many reasons for workforce change, some common ones include restructures, mergers and acquisitions, workforce downsizing or growth, or the creation of new business units. Even though any structural change is done with a particular goal in mind, it is often hard to predict their actual outcome. This is where software comes into play.
orginio’s new simulation function makes it possible to visualise potential changes and see the impacts on your organisations structure. Creating different simulations ensures well-informed decisions considering also the consequences of the reorganisation before putting it into place.
Model structures directly in an org chart
orginio allows you to model new structures without having to modify your main org chart.
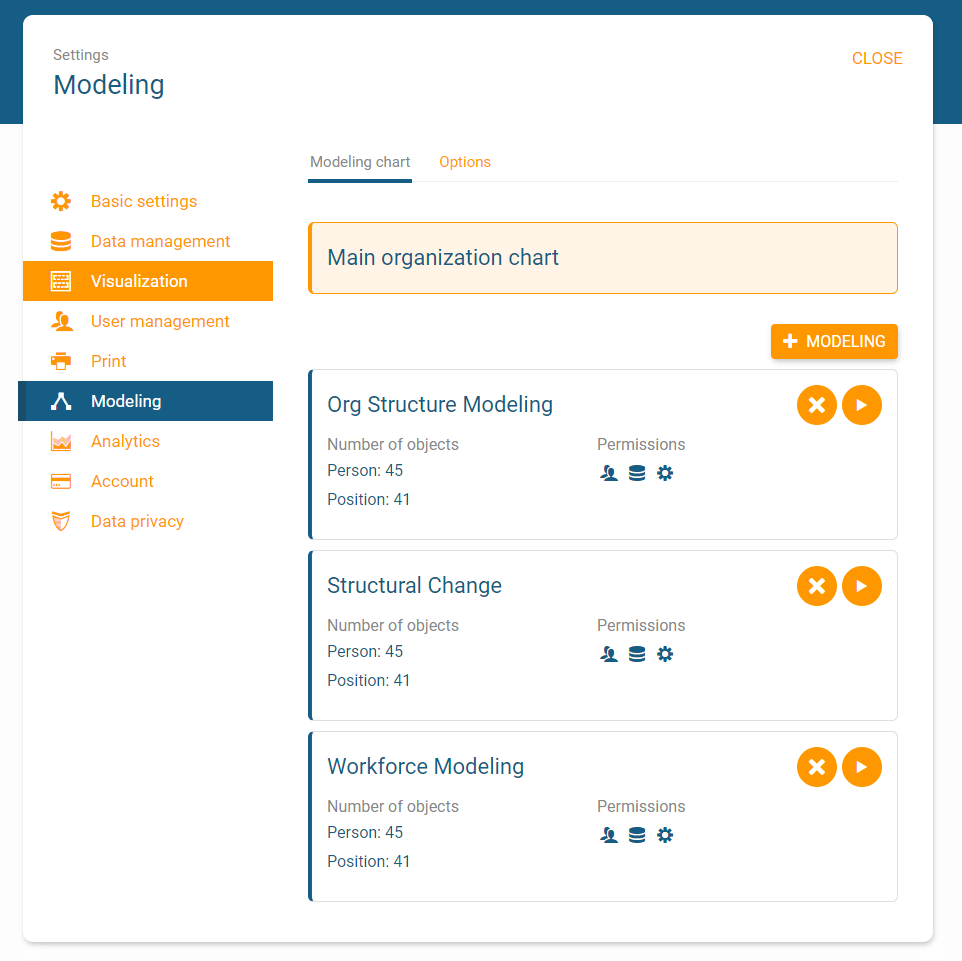
Maybe you have already noticed the new section ‘modelling’ in the settings. This is where you need to go to create and manage modelling charts.

Click on the ‘+ MODELLING’ button, name the simulation, and you are all set to start modelling.
Switch to edit mode and you can start mapping out all the workforce changes:
- Use drag & drop to move people, positions or even whole departments to another place in the org chart
- Add, change or delete departments, positions or people
KPIs included in your organisational chart will be updated automatically in real-time. Your initial org chart will not be affected by any changes made in the process.
You can create up to five different simulations in orginio allowing you to take into account several options. When viewing your org chart, you will be seeing a little dropdown list on top which makes it easy for you to switch between the main org chart and the modelling charts:
Workforce modelling key metrics
All key metrics which you have included in your org chart are updated automatically during the modelling process, allowing you to instantly see the impacts of every change.
Since neither the original org chart nor your HR data is changed by the modelling activities, you can also easily compare the status quo with your what-if scenarios. This provides you with a great basis for discussions about necessary reorganisations.
Below is a quick tour of workforce modelling in orginio:
Using display rules in a simulation
Just like for your main org chart, you can define individual display rules for your modelling charts. This helps you focus on key metrics that are particularly important for the current reorganisation project.
For instance, if you need to create a new business unit – it might be useful to highlight the employees have the skills and experience to take on the positions in this unit. Another example would be to flag all executives with a high span of control, allowing you to quickly determine if action needs to maintain a more sustainable workforce.
These is just two examples, there are countless other options when it comes to display rules. orginio opens up a lot of doors so you can make more informed decisions for your reorganisation.
")
How to securely collaborate on a simulation
If you have more than one person working on the modelling of org structures, you can allow other users of the main org chart to view and edit the simulation as well.

Add users to the modelling chart by clicking on the little ‘play’ button in the modelling section and then navigate to ‘user management’ in the settings. Click on ‘+ USERS’ to add any user to your simulation and determine their permissions.

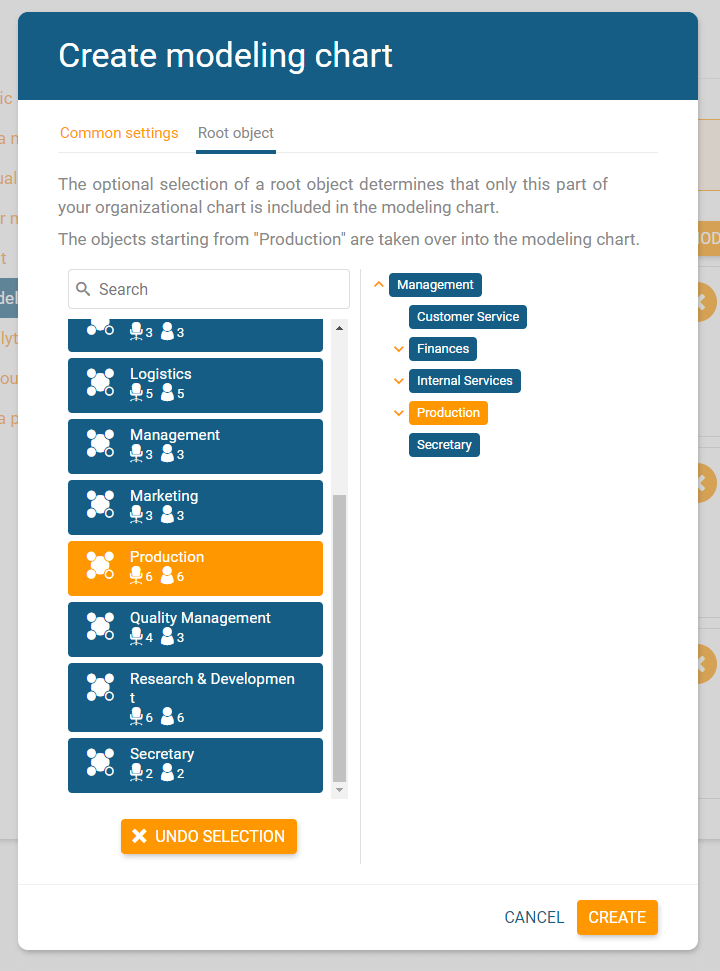
Define a root object for your modelling chart
Want to create a modelling chart that doesn’t display the whole org structure, but only that from a certain object downwards?
No problem, you can do this by creating a new modelling chart:
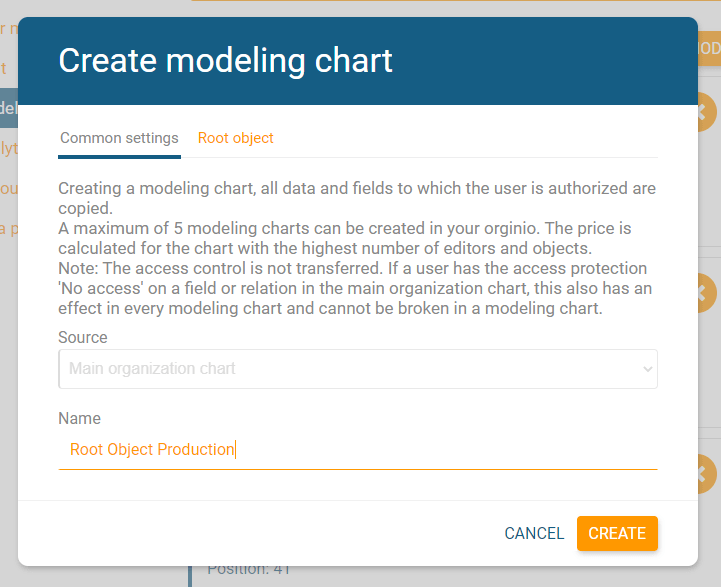
Navigate to ‘Settings’ – ‘Modelling’ and click on ‘+ Modelling’. In the first tab you can choose a name for your simulation. In the second one you can pick a root object out of all available objects in your current org chart.
After clicking ‘create’ your modelling chart is generated and you can access it – like any other – via the drop-down menu in viewing or editing mode to work with it.
If you’re having any issues with workforce modelling or anything else, please don’t hesitate to reach out to our team. We’d be happy to walk you through it.